'Grow and grow fast:' The newbie rule for regional banks

When Cadence Bancorp. agreed to buy State Bank Financial in June, it got more than just a beachhead in a new market.

Acquiring the $4.9 billion-asset Atlanta company would add heft that Cadence needs to help defray a sharp increase in regulatory expenses.

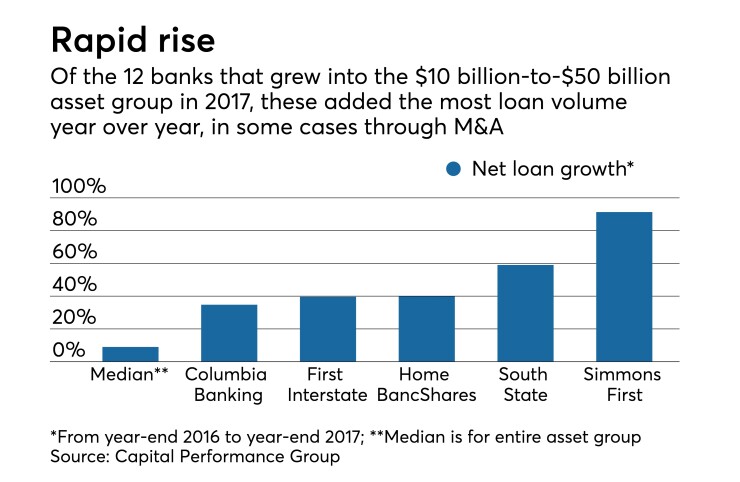
Cadence, which is based in Houston, is one of 12 banking companies included in this annual ranking for the first time because they grew above the $10 billion asset mark in 2017, a threshold where much more aggressive regulatory requirements kick in.

"It's really imperative for these banks that they're able to grow and grow fast to offset the new compliance costs," said Kevin Halsey, a consultant at Capital Performance Group.
ABM-080118-metrics.jpeg

The $10 billion mark has strategic implications. Crossing the line triggers costly stress tests and caps on interchange fees, and that requires giving careful consideration to the best way to build scale rapidly — either through organic growth or acquisitions.

Banks in the $10 billion to $50 billion asset class have pursued both tactics. The $15 billion-asset Simmons First National Corp. in Pine Bluff, Ark., and the $14 billion-asset Home BancShares in Conway, Ark., are serial acquirers that crossed the $10 billion threshold as of Dec. 31. Since 2016, Simmons has closed five deals and Home three.

Some larger banks in the group are doing well growing organically, Halsey said. The $25 billion-asset Texas Capital Bancshares in Dallas posted net loan growth of 17.5% in 2017, without an acquisition. That growth, which exceeds the overall peer group's median of 8.99%, came largely from commercial-and-industrial and commercial real estate lending.

See our other rankings:

Overall performance for banks in this asset class — ranked here by returns on average equity across three years — was mixed. Median net loan growth rose from the previous year's 7.8%, but core deposit growth slipped to 8.35% from 8.9%. The banks as a group posted higher revenue growth (a median of 9.61% for 2017, up from 7.35% the year before), but also higher noninterest expense growth (7.34%, up from 6.41%).

They excelled at improving efficiency, though. The median efficiency ratio dropped 274 basis points from the previous year, to 57.97%, according to CPG. And some of the newcomers set the pace; Home BancShares' efficiency ratio was 37.61%, and Cadence's was 52.69%.

Cadence hit $10 billion of assets during the third quarter of 2017, not long after its initial public offering in April. It makes sense that Cadence made a big acquisition so soon after reaching the milestone, said Halsey (who also wrote this BankThink on how banks can avoid pitfalls that undermine performance). The State Bank deal would boost Cadence's assets to about $16 billion.

Click on "view table" below to see the latest ranking.

Special offer for American Banker subscribers only: If you have a paid subscription to American Banker, you can request an Excel chart of data on these regional banks for a limited time. Capital Performance Group compiled the Excel chart, which shows additional metrics and analysis beyond the data points displayed below. To receive a reply, the request for this subscriber bonus must be received by bonnie.mcgeer@sourcemedia.com no later than August 3 and sent from the email address tied to the subscription. Include the name of the subscriber and the name of the institution in the body of the email. Please put “ranking request” in the subject line. Subscriptions will be verified and replies will follow within two weeks.

View Table
Printer Friendly Version
'Grow and grow fast:' The newbie rule for regional banks
Rank Institution/Ticker Location Total Assets ($000) 3-Year Avg. ROAE (%) ROAE (%) ROAA (%) Efficiency Ratio FTE (%) Net Interest Margin FTE (%) Net Income ($000) Net Loan Growth YOY (%) Core Deposit Growth YOY (%) Noninterest Exp. Growth (%)
1 Bank of Hawaii Corp. (BOH) Honolulu, HI 17,089,052 15.30 15.27 1.10 55.60 2.93 184,672 1.77 0.90 1.05
2 Western Alliance Bancorp. (WAL) Phoenix, AZ 20,329,085 15.00 15.65 1.72 41.48 4.65 325,492 25.29 17.18 13.31
3 FirstBank Holding Co. Lakewood, CO 17,571,047 14.11 14.41 1.24 52.63 3.61 212,560 11.50 3.19 3.97
4 Bank of the Ozarks (OZRK) Little Rock, AR 21,275,647 13.82 13.48 2.15 33.72 4.85 421,937 56.23 19.87 33.61
5 Midland Financial Co.* Oklahoma City, OK 14,750,650 13.39 8.97 0.86 62.50 3.33 204,131 (31.85) 10.23 7.27
6 East West Bancorp (EWBC) Pasadena, CA 37,150,249 13.17 13.71 1.41 47.88 3.49 505,624 17.13 8.35 5.48
7 Signature Bank (SBNY) New York, NY 43,117,720 11.83 10.11 0.95 34.14 3.09 387,209 (2.30) 4.40 15.48
8 Home BancShares (HOMB) Conway, AR 14,449,760 11.69 8.23 1.17 37.61 4.51 135,083 (23.74) 56.80 14.59
9 Commerce Bancshares (CBSH) Kansas City, MO 24,833,415 11.49 12.13 1.28 61.43 3.20 319,900 15.55 (1.03) 7.34
10 Bremer Financial Corp. Saint Paul, MN 11,994,235 11.43 11.37 1.06 61.04 3.60 124,024 4.90 11.23 1.61
11 Pinnacle Bancorp* Omaha, NE 10,394,487 11.16 11.04 1.15 55.89 3.65 169,792 3.51 9.30 7.05
12 Cullen/Frost Bankers (CFR) San Antonio, TX 31,747,880 10.36 11.48 1.20 54.56 3.68 364,149 19.68 4.32 3.16
13 Cathay General Bancorp (CATY) Los Angeles, CA 15,640,186 9.50 9.10 1.19 44.31 3.63 176,042 0.54 10.31 3.29
14 FCB Financial Holdings (FCB) Weston, FL 10,677,079 9.45 11.34 1.28 42.46 3.23 125,194 25.30 19.20 8.31
15 First Interstate BancSystem (FIBK) Billings, MT 12,213,255 9.29 8.57 0.98 59.08 3.64 106,521 11.38 38.46 14.90
16 Texas Capital Bancshares (TCBI) Dallas, TX 25,075,645 9.22 9.30 0.87 54.15 3.46 197,063 27.04 12.19 20.27
17 Hilltop Holdings Inc. (HTH) Dallas, TX 13,365,786 9.22 7.02 1.03 82.82 3.63 133,144 (10.00) 11.94 (2.98)
18 Community Bank System (CBU) De Witt, NY 10,746,198 9.22 10.21 1.49 57.67 3.69 150,717 45.18 20.36 21.13
19 MB Financial (MBFI) Chicago, IL 20,086,940 8.93 11.41 1.55 63.02 3.73 304,040 74.45 3.45 6.90
20 Flagstar Bancorp (FBC) Troy, MI 16,912,000 8.90 4.40 0.40 74.91 2.76 63,000 (63.16) (4.83) 14.64
21 Webster Financial Corp. (WBS) Waterbury, CT 26,487,645 8.89 9.76 0.97 61.39 3.31 255,439 23.32 7.21 6.22
22 UMB Financial Corp. (UMBF) Kansas City, MO 21,771,583 8.77 11.88 1.21 68.46 3.15 247,105 55.61 8.47 6.99
23 Hope Bancorp (HOPE) Los Angeles, CA 14,206,717 8.63 7.31 1.02 46.04 3.80 139,445 22.59 0.18 29.59
24 Pinnacle Financial Partners (PNFP) Nashville, TN 22,205,700 8.60 6.26 1.02 46.64 3.67 173,979 36.75 75.67 49.07
25 Washington Federal (WAFD) Seattle, WA 15,584,013 8.59 9.12 1.22 48.10 3.19 183,956 8.08 4.56 10.04
26 BOK Financial Corp. (BOKF) Tulsa, OK 32,272,160 8.46 9.77 1.02 64.61 2.88 335,685 44.52 (2.71) (0.48)
27 Synovus Financial Corp. (SNV) Columbus, GA 31,221,837 8.39 9.27 0.89 58.78 3.52 275,474 11.63 4.51 5.95
28 First Citizens BancShares (FCNC.A) Raleigh, NC 34,527,512 8.38 10.10 0.94 70.70 3.30 323,752 43.58 6.01 8.17
29 International Bancshares Corp. (IBOC) Laredo, TX 12,184,698 8.34 8.81 1.31 55.06 3.60 157,630 16.94 1.99 1.78
30 BancorpSouth Bank (BXS) Tupelo, MS 15,298,518 8.17 8.99 1.04 66.63 3.54 153,033 15.30 1.53 (1.43)
31 Wintrust Financial Corp. (WTFC) Rosemont, IL 27,915,970 8.07 9.07 0.98 62.45 3.44 257,682 24.56 8.02 7.63
32 Columbia Banking System (COLB) Tacoma, WA 12,716,886 8.06 8.00 1.11 56.18 4.18 112,828 7.59 31.21 5.03
33 South State Corp. (SSB) Columbia, SC 14,466,589 8.03 5.26 0.77 56.90 4.15 87,554 (13.55) 51.58 17.26
34 Central Bancompany (CBCY.B) Jefferson City, MO 12,891,144 7.96 7.34 1.01 58.66 3.27 128,050 (9.84) 4.23 1.89
35 Great Western Bancorp (GWB) Sioux Falls, SD 11,806,581 7.89 7.94 1.20 46.66 3.91 137,114 7.38 5.15 9.73
36 PacWest Bancorp (PACW) Beverly Hills, CA 24,994,876 7.85 7.71 1.58 41.63 5.10 357,818 1.60 22.59 7.11
37 United Community Banks (UCBI) Blairsville, GA 11,915,460 7.83 5.75 0.62 55.47 3.52 67,821 (32.62) 12.01 8.81
38 Prosperity Bancshares (PB) Houston, TX 22,587,292 7.82 7.26 1.22 40.66 3.19 272,165 (0.84) 4.89 (1.45)
39 Simmons First National Corp. (SFNC) Pine Bluff, AR 15,055,806 7.71 6.68 0.92 57.90 4.07 92,940 (4.00) 68.17 16.07
40 Fulton Financial Corp. (FULT) Lancaster, PA 20,036,905 7.63 7.83 0.88 66.35 3.28 171,753 6.27 6.36 7.73
41 Chemical Financial Corp. (CHFC) Midland, MI 19,280,873 7.37 5.69 0.81 52.58 3.48 149,523 38.41 5.71 39.11
42 Trustmark Corp. (TRMK) Jackson, MS 13,797,953 7.28 6.77 0.77 65.80 3.48 105,630 (2.57) 4.55 2.85
43 United Bankshares (UBSI) Charleston, WV 19,058,959 6.95 5.09 0.85 46.87 3.57 150,581 2.38 27.42 38.93
44 Old National Bancorp (ONB) Evansville, IN 17,518,292 6.90 4.98 0.63 63.89 3.48 95,725 (28.70) 18.38 (1.08)
45 Associated Banc-Corp (ASB) Green Bay, WI 30,483,594 6.79 7.23 0.78 63.97 2.82 229,264 14.48 0.76 1.52
46 Arvest Bank Group Bentonville, AR 16,788,378 6.74 8.83 0.79 74.03 3.35 134,897 36.96 1.03 1.65
47 First Midwest Bancorp (FMBI) Itasca, IL 14,077,052 6.69 5.37 0.70 59.12 3.87 98,387 6.54 23.20 21.49
48 F.N.B. Corp. (FNB) Pittsburgh, PA 31,417,635 6.48 4.89 0.68 54.25 3.43 199,204 16.57 31.80 32.67
49 Valley National Bancorp (VLY) Wayne, NJ 24,002,306 6.42 6.55 0.69 62.77 3.15 161,907 (3.71) (0.01) 3.84
50 Hancock Holding Co. (HBHC)** Gulfport, MS 27,336,086 6.38 7.68 0.82 58.98 3.43 215,632 44.43 13.99 10.77
51 First Horizon National Corp. (FHN) Memphis, TN 41,423,388 6.20 5.96 0.59 71.93 3.12 176,980 (25.80) 28.06 3.66
52 Umpqua Holdings Corp. (UMPQ) Portland, OR 25,741,439 6.00 6.20 0.98 63.35 3.90 246,019 5.61 5.83 1.70
53 IBERIABANK Corp. (IBKC) Lafayette, LA 27,904,129 5.82 4.06 0.58 59.22 3.64 142,413 (23.75) 24.89 13.46
54 People's United Financial (PBCT) Bridgeport, CT 44,453,400 5.78 6.03 0.79 59.41 2.98 337,200 20.00 9.04 7.59
55 Cadence Bancorp Houston, TX 10,949,338 5.75 7.63 0.94 52.69 3.59 94,216 44.27 8.11 2.60
56 Berkshire Hills Bancorp (BHLB) Pittsfield, MA 11,570,751 5.67 4.44 0.56 61.40 3.42 55,247 (5.83) 36.62 41.17
57 Eastern Bank Corp. Boston, MA 10,874,167 5.67 6.62 0.83 72.22 3.67 86,697 38.24 7.98 6.22
58 Apple Financial Holdings New York, NY 12,808,959 5.67 6.89 0.59 61.04 2.20 75,423 20.00 4.60 25.05
59 Sterling Bancorp (STL) Montebello, NY 30,359,541 5.54 3.72 0.50 41.26 3.54 93,031 (33.54) 91.91 23.82
60 Investors Bancorp (ISBC) Short Hills, NJ 25,129,244 5.11 4.00 0.52 57.97 2.87 126,744 (34.03) 12.55 16.18
61 New York Community Bancorp (NYCB) Westbury, NY 49,124,195 4.81 7.06 0.96 51.96 2.58 466,201 (5.89) (4.00) 0.45
62 Third Federal Savings Cleveland, OH 13,887,830 4.72 5.16 0.54 60.40 2.14 72,971 9.21 (4.35) 2.63
63 Stifel Financial Corp. (SF) Saint Louis, MO 21,383,953 4.47 6.44 0.92 89.18 2.38 182,871 124.33 16.37 9.19
64 BCI Financial Group Miami, FL 10,176,887 4.19 4.50 0.53 47.28 3.02 48,227 (30.25) 40.82 18.67
65 First BanCorp. (FBP) San Juan, PR 12,261,268 3.39 3.63 0.56 57.18 4.51 66,956 (28.18) 6.62 (2.98)
Median for all institutions 17,571,047 8.03 7.68 0.95 57.97 3.48 161,907 8.08 8.35 7.34
Median for the top 10 18,950,066 13.28 12.81 1.21 50.25 3.54 266,230 8.20 9.29 7.30
Average for all institutions 20,790,428 8.27 8.10 0.97 57.15 3.48 190,053 10.34 15.22 11.03
Average for the top 10 22,256,086 13.12 12.33 1.29 48.80 3.73 282,063 7.45 13.11 10.37

Notes: Ranking is of top consolidated bank holding companies, banks, and thrifts with total assets of between $10 billion and $50 billion as of 12/31/17 and is based on three-year average ROAE from 2015 to 2017. Additional data is for the 12 months ended 12/31/17; year-over-year changes compare 2017 to 2016. Financials are from SEC filings. If unavailable, regulatory financials were used. Excludes industrial banks, nondepository trusts, foreign-owned banks, and bankers' banks, as well as institutions with credit cards to total loans of more than 25%, loans to total assets of less than 20%, or loans to total deposits of less than 20% at 12/31/17. Excludes institutions with a leverage ratio of less than 5%, Tier 1 risk-based capital ratio of less than 6%, or total risk-based capital ratio of less than 10% during any quarter in the ranking period. Excludes institutions that received a tax benefit of greater than 10% of net income or that did not report data for any year in the ranking period. Also excludes institutions that have fewer than five depository branches and are owned by a company not primarily focused on commercial or retail banking. Ties broken using the 2017 ROAE and subsequently the 2016 ROAE.

* Denotes an institution that operated as a subchapter S corporation for at least one quarter between 2015 and 2017. Its profitability ratios were calculated from regulatory financials and adjusted using an assumed tax rate **The former Hancock Holding changed its name and ticker symbol as of May 25.

**The former Hancock Holding changed its name and ticker symbol as of May 25.

Source:

Capital Performance Group
analysis of data provided by S&P Global Market Intelligence.