p1ad16n33i15i2152e1oktv8fh7m8.jpg
p1ad16n33gk0h1mtfchh1gjkebc7.jpg

Quantifying the Cost of Compliance
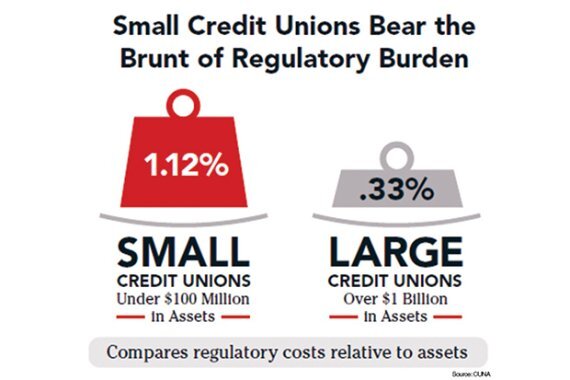
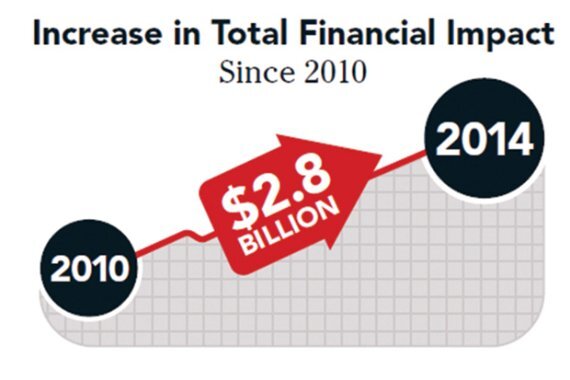
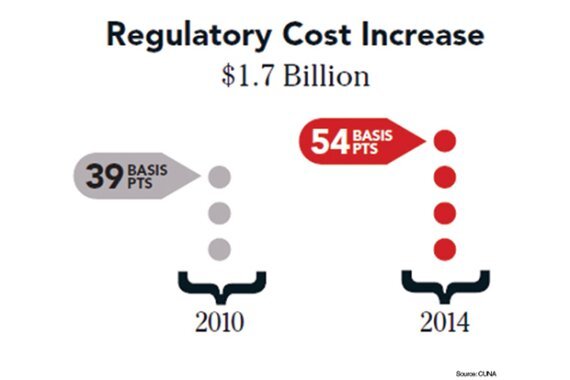
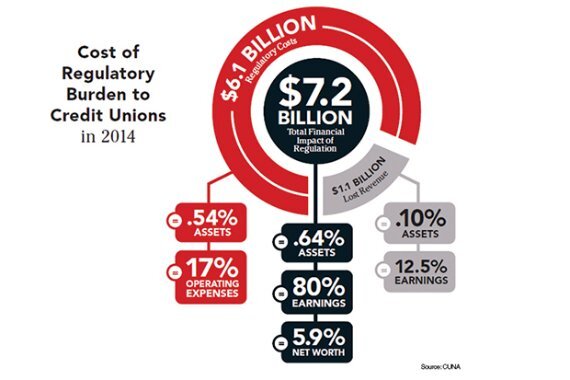
The costs associated with complying with rules and regulations increased $2.8 billion for credit unions between 2010 and 2014, according to a study commissioned by CUNA with support from state credit union leagues.Credit unions have often lamented that the plethora of new regulations implemented since the financial crisis have levied an undue regulatory burden on the industry. Up until now, however, the burden has often been relayed anecdotally. But CUNA commissioned Cornerstone Advisors to survey 53 credit unions in 2015 to quantify the problem. To bring scope—and concrete metrics—to the issue, Cornerstone Advisors measured costs as a percentage of assets and found that the cost of regulatory compliance equated to 0.54% of assets in 2014 which was up from 0.39% in 2010 and that there was a 0.10% decrease in revenue as a result of the opportunity cost of focusing on compliance rather than revenue generation. In all, regulatory burden in 2014 was the equivalent of 0.64% of assets, costing the industry $7.2 billion.The following are some highlights from the study that was presented at the CUNA government affairs conference:
p1ad16n33o1v4j1k51rs3oq5odnc.jpg

Burden is Greater at Small CUs

Regulatory burden hits small credit unions harder than larger ones because they do not have the same economies of scale or investment in IT infrastructure that can create efficiencies.The survey found that the median regulatory impact for credit unions with less than $115 million in assets -- categorized as small credit unions -- was 1.15% of assets. For mid-sized credit unions with between $115 million and $1 billion in assets, the regulatory burden was equal to 0.60% of those assets; and for large credit unions with more than $1 billion in assets, the regulatory burden was the equivalent of 0.44% of assets.
p1ad16n33l52p16nt1oba1k0ekq4b.jpg
While staff expenses represented the biggest cost associated with regulatory burden at 73% to 74% of the total burden, third-party vendor’s also accounted for a sizable chunk at 23% to 21% of the burden. Smaller CUs, however, dedicated almost half of their staff’s time to regulatory activities at 45% while large institutions dedicated only 17% of their employees’ time to compliance.Smaller credit unions also said 30% of staff costs were associated with risk management functions compared to mid-sized credit unions at 15% and 10% for large CUs. The higher cost for smaller credit unions is due, in part, because risk management functions can often be streamlined using IT assets.Instead, larger credit unions spent more on member-facing staff at 69% of employee costs because of the more complex loan mix they offer, while small credit unions said only 37% of staff costs were more directly associated with member-facing functions.
p1ad16n33i155717271rdqm4oo989.jpg

Lost Revenue

Regulations hurt revenues in three primary areas, including a decrease in loan originations, a reduction in fees and interchange income.But Cornerstone Advisors said it could only quantify lost revenue from lower interchange fees which it pegged at $1.1 billion or 13% of industry earnings in 2014 and attributed much of the loss to the Durbin Amendment, which had a direct impact on institutions with more than $10 billion in assets as well as a trickledown effect by creating more competition among card processors and lower average fees.
p1ad16n33lsvc1qk81ohrq5ci25a.jpg

Costs of (Not) Doing Business

The study noted that anecdotally credit unions say they lost revenue from mortgages they did not make because of mortgage regulations and fees that could have been generated from overdraft and non-sufficient funds fees.“When changes are made to Reg Z, Reg CC, etc., we are required to change many down line reporting and operational dashboards. This tends to take precedence over other revenue producing work,” one credit union chief executive officer who responded to the survey said.Another credit union CEO said: “During 2014, the credit union experienced 5 months of not being able to originate construction and development loans with over $25 million in lost loan opportunities” because of the member business lending caps.Others said they no longer make non-Qualified Mortgages even though it was a product they used to offer.“NCUA advised us to discontinue [non-QM loans] due to the regulatory burden,” a responding CEO noted.
p1ad16n33p1s9ft1idilbm78fed.jpg

Beyond Penalties

Though banking groups often point to the actual cost of fines as a concrete measure of the compliance burden, credit unions have largely avoided such penalties. But that doesn’t mean they don’t expend significant time, resources and funds on complying with regulations. Among the biggies are staffing and third-party expenses.
p1ad16n33ed0vjcotudgdd1kfe6.jpg

Plethora of Pain Points

“There was no consensus on which regulations imposed the most cost increase on credit unions,” the study said. Yet four key themes emerged including uncertainty around written rules, inconsistent interpretation of regulation by examiners, a consistent pipeline of new rules being implemented and a “one size fits all approach to regulation.”The report also found that while there is little doubt that regulations are having an impact on the cost of compliance, there is also much disparity between how much the burden is costing credit unions - implying some compliance costs can be managed.At the 25th percentile low-end, the survey found that regulations were costing CUs 0.29% of assets and 1.07% at the 75th percentile high-end.“Credit unions need to spend time and resources on re-work to ensure compliance — and (in some instances) realize later that the regulation does not apply to them. The lost productivity and the likely use of external resources to understand new rules contribute to a higher impact,” the study said.
MORE FROM AMERICAN BANKER