The top-performing banks with more than $50B of assets

First Citizens BancShares landed as the top-performing large bank for the second year in a row, still riding the windfall from its acquisition of the failed Silicon Valley Bank in 2023.

The list, which is based on year-end data for 2024, is compiled by the consulting firm Capital Performance Group. Rankings are based on banks' three-year average returns on average equity.

As high interest rates, election uncertainty and geopolitical tension have strained banks' operations since 2022, their returns on average equity have declined. In 2024, the top 10 performers logged a median return on average equity of 14.31% in 2024, down from 15.88% the previous year.

Still, the top 10 performers easily outpaced the 9.95% median for all banks across the asset tier.

Top Performing Banks 2025 logo

The top banks were also able to grow noninterest income faster than their peers, which helped them boost profits at a time when high interest rates were compressing margins.

On top of fee businesses, loan growth at the top performers outpaced peers. They reported  median growth of 4.10%, compared with 2.10% for all banks in the size group. Core deposits for the top 10 banks grew by 2.14%, compared with median growth of 1.88% across the asset tier.

Raleigh, North Carolina-based First Citizens doubled in size with its acquisition of SVB two years ago — a deal that also helped its returns skyrocket, as it was able to scale up at a discount. Since then, the bank's pace of growth has started to even out, but it still posted increases in loans and deposits that outpaced peers. The bank also logged one of the highest yields on assets among banks in its asset tier.

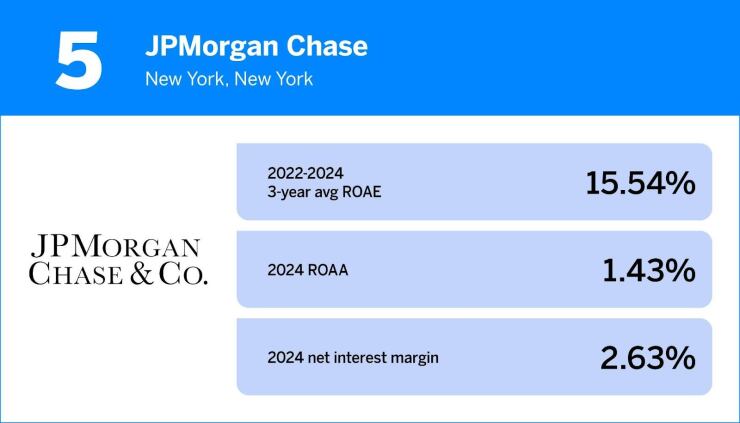
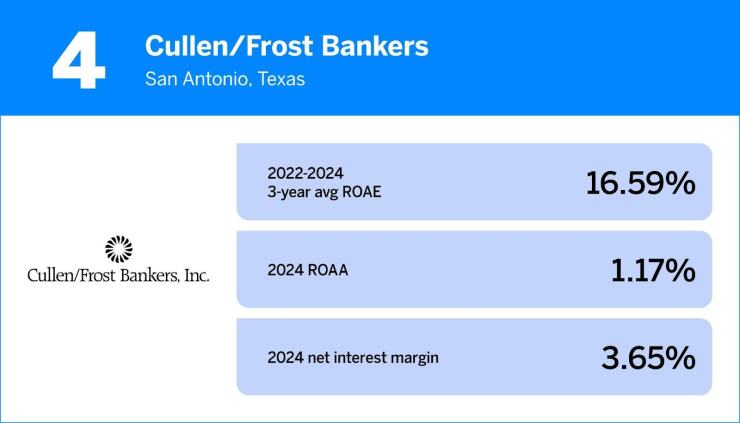
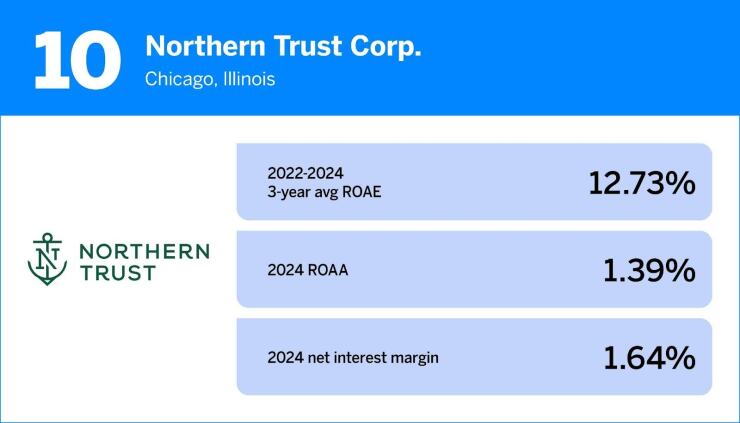
Below are performance metrics from 2024 for the 10 highest-performing banks with more than $50 billion of assets. Click on the table at the bottom of the page for the full ranking of banks in the asset class.
View Table
Printer Friendly Version
Banks with assets of greater than $50 Billion

Rankings
Banks with assets of greater than $50 Billion
             
  Total Assets ROAA 3-Year Avg
 ROAE
ROAE ROAE ROAE ROACE Net Interest
Margin (FTE)
Efficiency Ratio
 (FTE)
Total Nonint
 Income
Net Income Net Income Net Income
 Change
Total
Risk-Based Cap
2024 2023 ($000) (%) (%) (%) (%) (%) (%) (%) (%) ($000) ($000) ($000) ($000) Ratio (%)
Rank Rank Institution Name City State 12/31/24 2024 2022-2024 2024 2023 2022 2024 2024 2024 2024 2024 2023 2023-2024 12/31/24
                                     
    Median: All Institutions     155,508,400 1.00 10.84 9.95 10.29 11.47 10.38 2.93 60.66 2,143,000 1,141,934 916,000 65,300 14.31
    Median: Top 10 Institutions     81,608,000 1.22 15.36 14.31 15.88 16.09 14.39 3.13 62.52 870,000 976,643 994,150 78,260 15.07
    Average: All Institutions     478,859,045 0.97 10.88 9.69 11.15 11.79 9.82 2.86 62.21 8,448,196 4,795,145 4,377,358 417,788 15.15
    Average: Top 10 Institutions     489,223,680 1.33 16.70 14.61 19.61 15.87 14.88 3.03 62.14 10,078,951 6,990,817 6,824,586 166,231 15.91
       
1 1 First Citizens BancShares, Inc. Raleigh NC 223,720,000 1.26 29.02 12.45 63.92 10.69 12.68 3.54 58.20 2,598,000 2,777,000 11,466,000 (8,689,000) 15.04
2 3 Raymond James Financial, Inc. Saint Petersburg FL 82,282,000 2.66 17.81 19.21 17.11 17.10 19.25 3.51 78.82 11,389,065 2,170,000 1,728,000 442,000 25.00
3 4 East West Bancorp, Inc. Pasadena CA 75,976,475 1.60 17.78 15.93 17.91 19.51 15.93 3.27 36.49 333,149 1,165,586 1,161,161 4,425 15.58
4 7 Cullen/Frost Bankers, Inc. San Antonio TX 52,520,259 1.17 16.59 15.38 18.05 16.35 15.54 3.65 60.39 459,194 582,542 597,973 (15,431) 15.53
5 6 JPMorgan Chase & Co. New York NY 4,002,814,000 1.43 15.54 17.38 16.01 13.22 18.21 2.63 53.62 77,834,000 58,471,000 49,552,000 8,919,000 17.92
6 2 Western Alliance Bancorporation Phoenix AZ 80,934,000 0.99 15.17 12.16 12.63 20.74 12.53 3.58 63.39 480,100 787,700 722,400 65,300 14.14
7 5 Comerica Incorporated Dallas TX 79,297,000 0.87 14.83 10.90 15.75 17.84 11.16 2.99 70.69 1,072,000 698,000 881,000 (183,000) 14.21
8 NA UMB Financial Corporation Kansas City MO 50,409,664 1.02 13.77 13.24 12.23 15.83 13.24 2.51 61.64 605,397 441,243 350,024 91,219 13.21
9 9 Zions Bancorporation, National Association Salt Lake City UT 88,775,000 0.88 13.73 12.95 12.88 15.34 12.95 3.00 64.28 668,000 784,000 680,000 104,000 13.34
10 16 Northern Trust Corporation Chicago IL 155,508,400 1.39 12.73 16.51 9.63 12.06 17.28 1.64 73.87 5,350,600 2,031,100 1,107,300 923,800 15.09
11 12 Fifth Third Bancorp Cincinnati OH 212,927,000 1.09 12.67 11.93 13.27 12.82 12.47 2.90 58.79 2,781,000 2,314,000 2,349,000 (35,000) 13.86
12 11 Regions Financial Corporation Birmingham AL 157,302,000 1.23 12.32 10.80 12.54 13.60 11.23 3.54 57.53 2,473,000 1,893,000 2,074,000 (181,000) 14.06
13 10 Synovus Financial Corp. Columbus GA 60,233,644 0.81 12.27 9.24 11.46 16.12 9.50 3.16 54.92 496,983 479,451 542,141 (62,690) 13.81
14 18 The PNC Financial Services Group, Inc. Pittsburgh PA 560,038,000 1.05 11.85 11.32 11.60 12.64 11.85 2.66 60.61 7,802,000 5,953,000 5,647,000 306,000 13.57
15 19 Wintrust Financial Corporation Rosemont IL 64,879,668 1.17 11.77 11.93 12.40 11.00 12.32 3.53 56.44 471,628 695,045 622,626 72,419 12.27
16 8 Popular, Inc. Hato Rey PR 73,045,383 0.84 11.75 8.71 8.20 18.35 8.72 3.49 60.80 636,951 614,212 541,342 72,870 17.83
17 NA Morgan Stanley New York NY 1,215,071,000 1.10 11.07 13.23 9.14 10.83 13.96 1.04 70.11 49,939,000 13,529,000 9,230,000 4,299,000 19.90
18 23 Huntington Bancshares Incorporated Columbus OH 204,230,000 1.00 10.93 9.95 10.55 12.29 10.38 3.00 61.15 2,061,000 1,960,000 1,971,000 (11,000) 14.31
19 15 U.S. Bancorp Minneapolis MN 678,318,000 0.95 10.84 10.97 10.08 11.47 11.72 2.70 60.16 11,200,000 6,329,000 5,458,000 871,000 14.29
20 14 Columbia Banking System, Inc. Tacoma WA 51,576,397 1.03 10.48 10.55 7.81 13.07 10.55 3.58 50.45 211,334 533,675 348,715 184,960 12.75
21 20 First Horizon Corporation Memphis TN 82,152,000 0.97 9.87 8.69 10.29 10.63 8.80 3.35 60.66 768,000 794,000 916,000 (122,000) 14.25
22 NA Old National Bancorp Evansville IN 53,552,272 1.03 9.62 8.96 11.08 8.82 9.06 3.31 55.87 354,009 539,188 581,992 (42,804) 13.37
23 21 Bank of America Corporation Charlotte NC 3,261,519,000 0.83 9.59 9.23 9.36 10.18 9.53 1.96 65.38 45,856,000 27,132,000 26,515,000 617,000 15.06
24 24 Wells Fargo & Company San Francisco CA 1,929,845,000 1.04 9.49 10.86 10.29 7.30 11.37 2.73 65.36 34,470,000 19,965,000 19,029,000 936,000 15.18
25 25 M&T Bank Corporation Buffalo NY 208,105,000 1.23 9.39 9.23 10.58 8.36 9.53 3.58 56.17 2,369,000 2,588,000 2,741,000 (153,000) 14.73
26 NA Pinnacle Financial Partners, Inc. Nashville TN 52,589,449 0.96 9.26 7.63 9.70 10.44 7.66 3.16 55.78 414,108 475,056 562,152 (87,096) 13.14
27 22 Webster Financial Corporation Stamford CT 79,025,073 1.00 9.13 8.62 10.43 8.34 8.62 3.42 47.27 378,380 768,707 867,840 (99,133) 14.24
28 30 CIBC Bancorp USA Inc. Chicago IL 77,456,368 1.53 8.01 9.58 6.75 7.69 9.71 2.77 47.89 1,663,925 1,141,934 732,352 409,582 18.74
29 13 Ally Financial Inc. Detroit MI 191,836,000 0.35 7.93 4.81 7.07 11.91 4.84 2.93 65.85 3,450,000 668,000 957,000 (289,000) 13.16
30 26 Valley National Bancorp Morristown NJ 62,491,691 0.61 7.54 5.51 7.60 9.50 5.43 2.85 57.56 213,553 380,271 498,511 (118,240) 13.87
31 27 Citizens Financial Group, Inc. Providence RI 217,521,000 0.69 7.28 6.30 6.81 8.73 6.27 2.85 66.39 2,143,000 1,509,000 1,608,000 (99,000) 14.02
32 17 KeyCorp Cleveland OH 187,168,000 (0.09) 6.31 (1.04) 6.97 13.01 (2.36) 2.23 69.67 2,668,000 (161,000) 967,000 (1,128,000) 16.15
33 29 Citigroup Inc. New York NY 2,352,945,000 0.52 6.05 6.17 4.51 7.48 6.03 2.40 66.20 26,303,000 12,833,000 9,381,000 3,452,000 15.42
34 33 BMO Financial Corp. Chicago IL 292,580,781 0.99 4.59 8.49 0.38 4.90 8.53 2.85 51.40 2,521,493 2,966,261 121,070 2,845,191 14.61
35 34 RBC US Group Holdings LLC Toronto 168,950,514 1.19 3.96 8.69 (3.52) 6.72 8.66 2.88 76.41 6,663,347 2,030,447 (737,304) 2,767,751 18.01
36 35 HSBC North America Holdings Inc. New York NY 230,029,621 0.30 3.03 4.93 1.88 2.29 4.77 0.75 77.78 3,053,031 699,949 270,933 429,016 15.70
37 32 Flagstar Financial, Inc. Hicksville NY 100,160,000 (0.97) (1.46) (12.81) (0.75) 9.18 (14.38) 1.93 103.76 432,000 (1,118,000) (79,000) (1,039,000) 15.14