NCUA Q4 2016 state=level data cover slide
Business Team Investment Entrepreneur Trading Concept

NCUA maps final 2016 data state-by-state

NCUA recently released its latest Quarterly U.S. Map Review, in which the regulator tracks a variety of performance indicators, including membership, loans, shares, delinquencies and others. It said federally insured credit unions “saw continued improvement in nearly every category in the fourth quarter of 2016.”

Some highlight figures: nationally, for the year ending Dec. 31, 2016, median loan growth in federally insured credit unions was 4.0 percent, median asset growth was 3.2 percent, the median rate of growth in deposits and shares was 3.3 percent, and the median loans-to-shares ratio rose to 64 percent.
NCUA Median annual asset growth - 031717
Passman, Aaron

Median annual asset growth

Nationally, the median asset growth rate over the year ending in the fourth quarter of 2016 was 3.2 percent. In other words, the agency said, half of all federally insured credit unions had asset growth at or above 3.2 percent and half had asset growth of 3.2 percent or less. In the year ending in the fourth quarter of 2015, the median growth rate in assets was 3.3 percent.
p19cr0t5jvkbp1a5tgvomos1rkj7.jpg

Rising assets in Oregon and Nevada

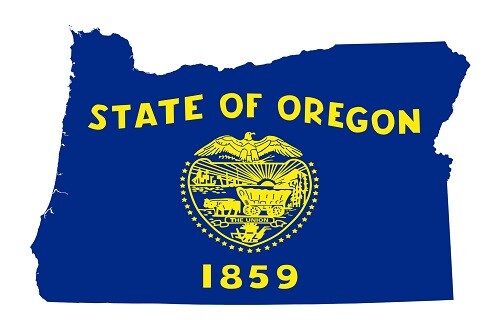
At the median, assets rose in each state over the year ending in the fourth quarter of 2016. Median asset growth was highest in Oregon (6.9 percent), followed by Nevada (6.4 percent).
p1a1v2b8ma1q0g15qm1imb5aa16cm8.jpg

Arkansas and DC still struggling

For the second consecutive quarter, median asset growth was slowest in Arkansas (0.5 percent) and the District of Columbia (1.1 percent).
NCUA median annual share and deposit growth - 031717
Passman, Aaron

Median annual share and deposit growth

Nationally, the median growth rate in shares and deposits over the year ending in the fourth quarter of 2016 was 3.3 percent. In the year ending in the fourth quarter of 2015, the median growth rate in shares and deposits was 3.6 percent.
p18v89jvv31ktbppgji936f1d68c.jpg

Share and deposit growth

At the median, shares and deposits rose in each state over the year ending in the fourth quarter of 2016. The median growth rate in shares and deposits was highest in Washington (6.7 percent) and Oregon (6.6 percent)
p1a1v2b8md1siu5gok7thpo2od.jpg

Arkansas and Louisiana struggle for shares and deposits

The median growth rate in shares and deposits was lowest in Arkansas (0.3 percent) and Louisiana (0.5 percent).
NCUA median annual membership growth - 031717
Passman, Aaron

Median annual membership growth

While overall membership in federally insured credit unions continued to grow in the year ending in the fourth quarter of 2016, at the median, membership declined 0.1 percent. Over the previous year, the median membership growth rate was -0.2 percent. Overall, 51 percent of federally insured credit unions had fewer members at the end of the fourth quarter of 2016 than a year earlier. NCUA said credit unions with falling membership tend to be small: about 75 percent had less than $50 million in assets.
p19es0pab518ih771hl665m166rg.jpg

Membership soars in Alaska and Maine

Over the year ending in the fourth quarter of 2016, Alaska had the highest median membership growth rate (2.4 percent), followed by Maine (2.0 percent).
p19su1unat3j41aob1iotos44kob.jpg

Membership continues to slide in Pennsylvania

In 23 states, the median membership growth rate for federally insured credit unions was negative. At the median, membership declined the most in the District of Columbia (-1.9 percent), followed by Pennsylvania (-1.5 percent). Pennsylvania had the largest decline in this category the previous three quarters.
NCUA median annual loan growth - 031717
Passman, Aaron

Median annual loan growth

Nationally, the median growth rate in loans outstanding was 4.0 percent over the year ending in the fourth quarter of 2016, matching the median loan growth rate during 2015.
p1904medfb23hegj5pcuu51m9eq.jpg
Mount Hood rising above downtown Portland, Oregon
Jess Kraft/jkraft5 - Fotolia

Rising lending across the northwest

At the median, loans outstanding rose in each state over the year ending in the fourth quarter of 2016. The highest median growth rate in loans outstandng was in Oregon and Alaska (both 8.9 percent), followed by Washington (8.6 percent). Oregon and Washington were the top two in Q3 2016.
p19d5qku781il34951ct516gap15d.jpg

Connecticut, Pennsylvania struggle for loan growth

For the second consecutive quarter, median loan growth was slowest in Connecticut (0.1 percent) and Pennsylvania (0.6 percent).
NCUA Median annual total delinquency rate - 031717
Passman, Aaron

Median total delinquency rate unchanged

At the end of the fourth quarter of 2016, the median total delinquency rate among federally insured credit unions was 81 basis points, unchanged from the fourth quarter of 2015.
p19erv6tk11uci18c2v7jjmpmcub.jpg

Delinquencies remain high in Jersey

At the end of the fourth quarter of 2016, the median delinquency rate was highest in New Jersey (168 basis points), followed by Mississippi (143 basis points) New Jersey has been atop this category for three straight quarters.
p1a1guhdcorik1pnl180e1mcduoce.jpg

North Dakota, Oregon show lowest delinquency rates

At the end of the fourth quarter of 2016, the median delinquency rate was lowest in North Dakota (36 basis points), followed by Oregon (38 basis points).
ncua - median loans-to-shares - 031717
Passman, Aaron

Median loans-to-shares ratio

Nationally, the median ratio of total loans outstanding to total shares and deposits (the loans-to-shares ratio) was 64 percent at the end of the fourth quarter of 2016. At the end of the fourth quarter of 2015, the median loans-to-shares ratio was 62 percent.
p19smp8e142e31i0uug01qbrn6of.jpg

Idaho, Alaska lead in loans-to-shares

The median loans-to-shares ratio was highest in Idaho (87 percent) and Alaska (86 percent). Alaska has been in the top two in this category for four consecutive quarters.
p19es0740p18mbufukiqpla1btk6.jpg

Delaware, Hawaii see lowest loans-to-shares ratios

The median loans-to-shares ratio was lowest in Delaware (46 percent), followed by Hawaii (47 percent). These two states were lowest in this category in all four quarters in 2016.
NCUA median ROA - 031717
Passman, Aaron

Median return on average assets

Nationally, the median return on average assets at federally insured credit unions was 35 basis points during 2016. The median return on average assets was 33 basis points during 2015.
p19vh258pk1s0kapu1ilg12fi1s1cf.jpg

Vermont, Nevada lead ROA

Vermont (79 basis points) had the highest median return on average assets during 2016, followed by Nevada (70 basis points).
p19smbf3l6fks13ui13v238rapgc.jpg

DC, Delaware see lowest ROA

The District of Columbia (6 basis points) had the lowest median return on average assets, followed by Delaware (12 basis points).
NCUA positive net income - 031717
Passman, Aaron

Positive net income on the rise

Nationally, 81 percent of federally insured credit unions had positive net income during 2016, up from 79 percent in 2015. At least half of credit unions in every state had positive net income during 2016.
p1a1guhdcl1m2411hj1lr8qg9g918.jpg

Iowa, North Dakota have highest positive net incomes

The share of federally insured credit unions with positive net income was highest in Iowa and North Dakota (both 95 percent), followed by New Hampshire (94 percent).
p19es0e7fsg291n9a1n1833m1mq56.jpg

DC, Arkansas have lowest positive net income again

The share of federally insured credit unions with positive net income was lowest in the District of Columbia (60 percent) and Arkansas (66 percent). Arkansas and D.C. were two of the three lowest in Q3.
MORE FROM AMERICAN BANKER