p1atcamlel1dnu1q6612751c1761u6.jpg
The National Credit Union Administration recently released its Quarterly U.S. Map Review, in which the regulator tracks a variety of performance indicators, including membership, loans, shares, delinquencies and others. It said federally insured credit unions “experienced continued improvement in nearly every category in the second quarter.” Two highlight figures: nationally, for the year ending June 30, 2016, median loan growth in federally insured credit unions was 4.3% while median asset growth was 3.2%. Click through to see more highlights from the report.
p1atckmfot1qsitp31mnuba89lk6.jpg
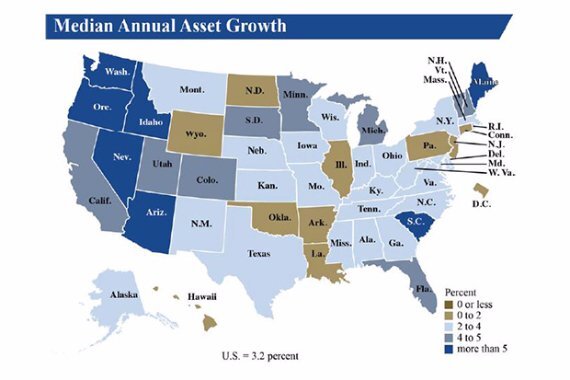
Nationally, the median asset growth rate over the year ending in the second quarter of 2016 was 3.2%. In other words, the agency said, half of all federally insured credit unions had asset growth at or above 3.2% and half had asset growth of 3.2% or less. In the year ending in the second quarter of 2015, the median growth rate in assets was 1.9%.
p1atckmfp117s7ip71rbp9251s2s7.jpg
Over the year ending in the second quarter of 2016, the median asset growth rate was highest in South Carolina and Nevada (both 6.4%).
p1atcamlh416j25if1ej414d63a29.jpg
At the median, assets rose in each state over the year ending in the second quarter of 2016. Median asset growth was slowest in Louisiana (0.8%) and Connecticut (0.9%).
p1atckmfq95s5881qcs1h0t137u8.jpg
Nationally, the median growth rate in shares and deposits over the year ending in the second quarter of 2016 was 3.3%. In the year ending in the second quarter of 2015, the median growth rate in shares and deposits was 1.8%.
p1atcamljgp0a27i1cqmh2mjnbb.jpg
Over the year ending in the second quarter of 2016, the median growth rate in shares and deposits was highest in Idaho (7.3%) and Washington (6.5%).
p1atcamlkn15a31kcf134872o5glc.jpg
At the median, shares and deposits rose in each state over the year ending in the second quarter of 2016. The median growth rate in shares and deposits was lowest in Louisiana (0.7%) and Washington, D.C. (0.9%).
p1atckmfrhg9d1tpb5j1aql2vv9.jpg
While overall membership in federally insured credit unions continued to grow in the year ending in the second quarter of 2016, at the median, membership was unchanged. Over the previous year, the median membership growth rate was -0.3%. Zero median growth means, overall, 50% of federally insured credit unions had fewer members at the end of the second quarter of 2016 than a year earlier. Credit unions with falling membership tend to be small; about 75% had less than $50 million in assets.
p1atckmfso1jrvps8q3m1tp11pbua.jpg
Over the year ending in the second quarter of 2016, Alaska had the highest median membership growth rate (3.1%), followed by Idaho (2.4%).
p1atcamlp8mqv4i21a8r1av2u6ef.jpg
In 18 states, the median membership growth rate for federally insured credit unions was negative. At the median, membership declined the most in Pennsylvania (-1.6%). Pennsylvania also had the largest percentage decline in Q1.
p1atckmfsodau1hgdm001ub6145nb.jpg
Nationally, the median growth rate in loans outstanding was 4.3% over the year ending in the second quarter of 2016. During the previous year, the median loan growth rate was 4.0% nationally.
p1atckmftu6bjuic1a6hpck89jc.jpg
The highest median growth rate in loans outstanding was in Nevada (10.0%), followed by Washington (9.2%). Nevada and Washington also led this category in Q1.
p1atcamlt288hle81ai21qh31t70i.jpg
At the median, loans outstanding rose in each state over the year ending in the first quarter of 2016. Median loan growth was slowest in Pennsylvania (0.8%) and the District of Columbia (1.3%).
p1atckmfv51tmsfuq6d4snnh54d.jpg
At the end of the second quarter of 2016, the median total delinquency rate among federally insured credit unions was 0.7%, down slightly from 0.8% in the second quarter of 2015.
p1atcamlvgfrq8k616dnn7g1aldk.jpg
The median delinquency rate was highest in New Jersey (1.7%), followed by Delaware and Washington, D.C. (both 1.3%).
p1atcamm0narh1lshsm5e101o5dl.jpg
At the end of the second quarter of 2016, the median delinquency rate was lowest in New Hampshire (0.3%).
p1atcamm1t4jeekd1tfqfvk1lk4m.jpg
Nationally, the median ratio of total loans outstanding to total shares and deposits (the loans-to-shares ratio) was 62% at the end of the second quarter of 2016. At the end of the second quarter of 2015, the median loans-to-shares ratio was 60%.
p1atcamm341d4c1dteqro1lre1on.jpg
The median loans-to-shares ratio was highest in Idaho and Alaska (both 86%). These two states also led this category in Q1.
p1atcamm4c48dd591ekms04ts5o.jpg
The median loans-to-shares ratio was lowest in Delaware (44%), followed by Hawaii (45%). These two states were lowest in this category in Q1.
p1atcamm5jktl2e81l2r16b3jj1p.jpg
Nationally, the median return on average assets at federally insured credit unions was 35 basis points at an annual rate during the first half of 2016. The median return on average assets was 33 basis points during the first half of 2015.
p1atcbf3lfpth14vcrpjfc71lt76.jpg
Vermont (72 basis points) had the highest median return on average assets during the first half of 2016, followed by Nevada (71 basis points).
p1atcbf3lg1r6kjhu1qil1lhfigv7.jpg
Delaware (6 basis points) had the lowest median return on average assets, followed by Washington, D.C. and New Jersey (both 18 basis points).
p1atcbf3lhcbb1gmma0nhspovb8.jpg
Nationally, 79% of federally insured credit unions had positive net income during the first half of 2016, up from 77% in the first half of 2015. At least half of credit unions in every state had positive net income during the first half of 2016.
p1atcbf3mqe8h7sg1an5183t1ha99.jpg
The share of federally insured credit unions with positive net income was highest in Nevada (100%) and North Dakota (95%).
p1atcbf3o01fvkgrlerho11nksa.jpg
The share of federally insured credit unions with positive net income was lowest in Delaware (55%), followed by Washington, D.C., Arkansas and New Jersey (all 66%).
MORE FROM AMERICAN BANKER