Data Sources: Data are provided by SNL Securities, Charlottesville, Va.
-
Threat group ShinyHunters claimed responsibility for the attack, which reportedly targeted third-party platforms rather than Betterment's own systems.
9h ago -
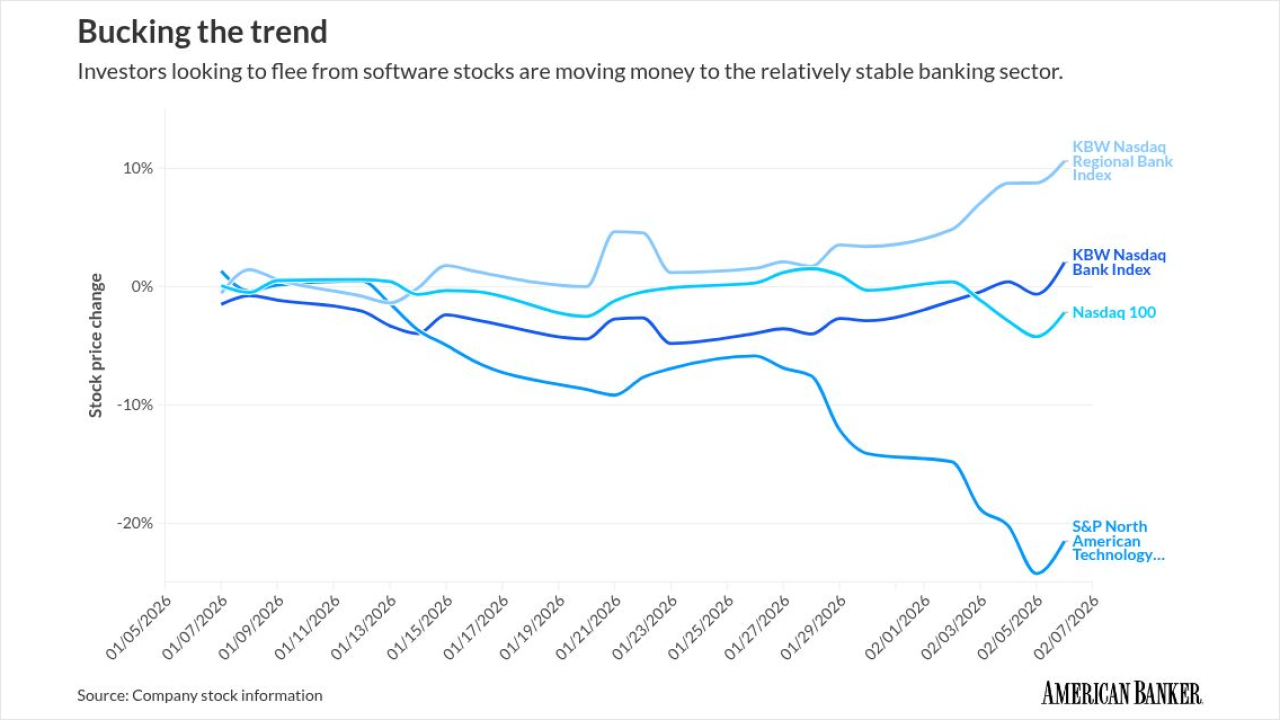
Artificial intelligence developments are stoking investor fears about software companies. Banks' limited exposure to the sector and general stability is proving attractive to investors.
9h ago -
Prosperity Bancshares finalizes the second of three acquisitions it's announced since July; Sumitomo Mitsui Banking Corporation appoints a new chief information security officer for its American operations; Huntington Bancshares, Third Coast Bancshares and Heritage Financial completed acquisitions; and more in this week's banking news roundup.
10h ago -
Fintech and crypto groups said in comment letters to the Federal Reserve that the proposed "skinny" master account is too limited and could keep firms dependent on banks. Banking groups asked for more time to comment.
11h ago -
Federal Reserve Vice Chair Philip Jefferson said in a speech Friday that long-term productivity gains brought on by artificial intelligence could compel the central bank to maintain higher rates to keep prices stable.
February 6 -
While the e-commerce giant has deemphasized the technology, banks and payment firms are testing the biometric option.
February 6


