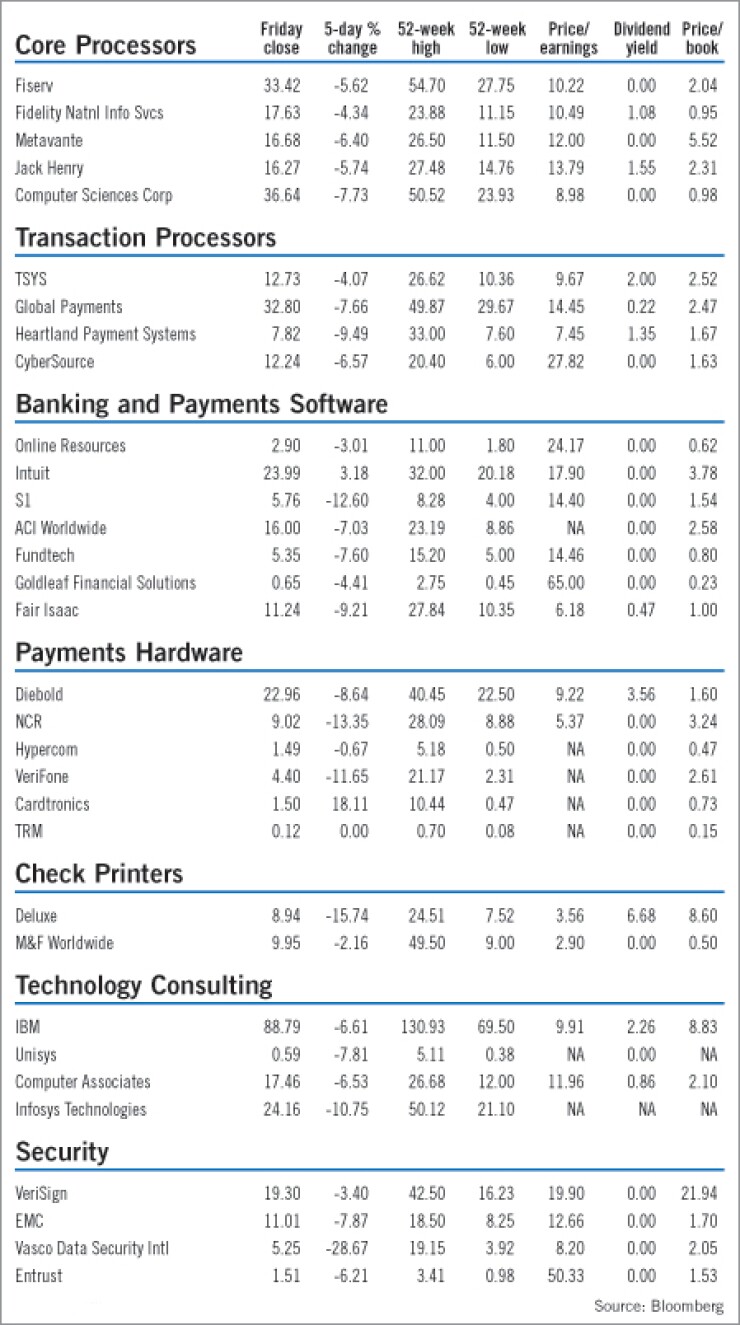

The table lists daily composite stock prices at 4 PM (unless otherwise noted) as measured by market capitalization.
52 Wk Hi Lo shows the moving 52-week high and low closing prices for the stock. PE represents the current stock price (if no trades for the day, the latest bid) divided by the trailing four-quarter earnings per share adjusted for the latest announced earnings. The ratio is annualized for companies with less than four quarters of data. Dividend Yield is the percentage paid on a common stock in dividends.
The dagger symbol (†) means ex-dividend, LT=limited trading, NM=not meaningful, NA=not available. Prices unchanged from the previous day’s or week’s close are indicated with a "...". H=A common stock share buy back plan is in effect. (1) - 1/10th value of Class A shares.


