| ||||||||||||||||||||||||||||||||||||||||||||||||||||||||||||||||||||||||||||||||||||||||||||||||||||||||||||||||||||||||||||||||||||||||||||||||||||||||||||||||||||||||||||||||||||||||||||||||||||||||||||||||||||||||||||||||||||||||||||||||||||||||||||||||||||||||||||||||||||||||||||||||||||||||||||||||||||||||||||||||||||||||||||||||||||||||||||||||||||||||||||||||||||||||||||||||||||||||||||||||||||||||||||||||||||
-
A housing bill that already passed the Senate cleared the House Monday evening, but included bipartisan community banking provisions that have already raised objections in the upper chamber.
10h ago -
Fifteen banks have failed since November 2019, with the most recent one occurring on Jan. 30.
February 9 -
The Government Accountability Office was tasked with investigating the Consumer Financial Protection Bureau's stop-work order, but CFPB officials refused to meet with or provide information to Congress' investigative arm.
February 9 -
Federal Reserve Gov. Christopher Waller said comments from banks and fintech firms reveal sharply different priorities in the creation of the central bank's proposed "skinny" master accounts.
February 9 -
Check fraud has risen 385% since the pandemic, with criminals using stolen mail and digital tools to deceive major financial institutions.
February 9 -
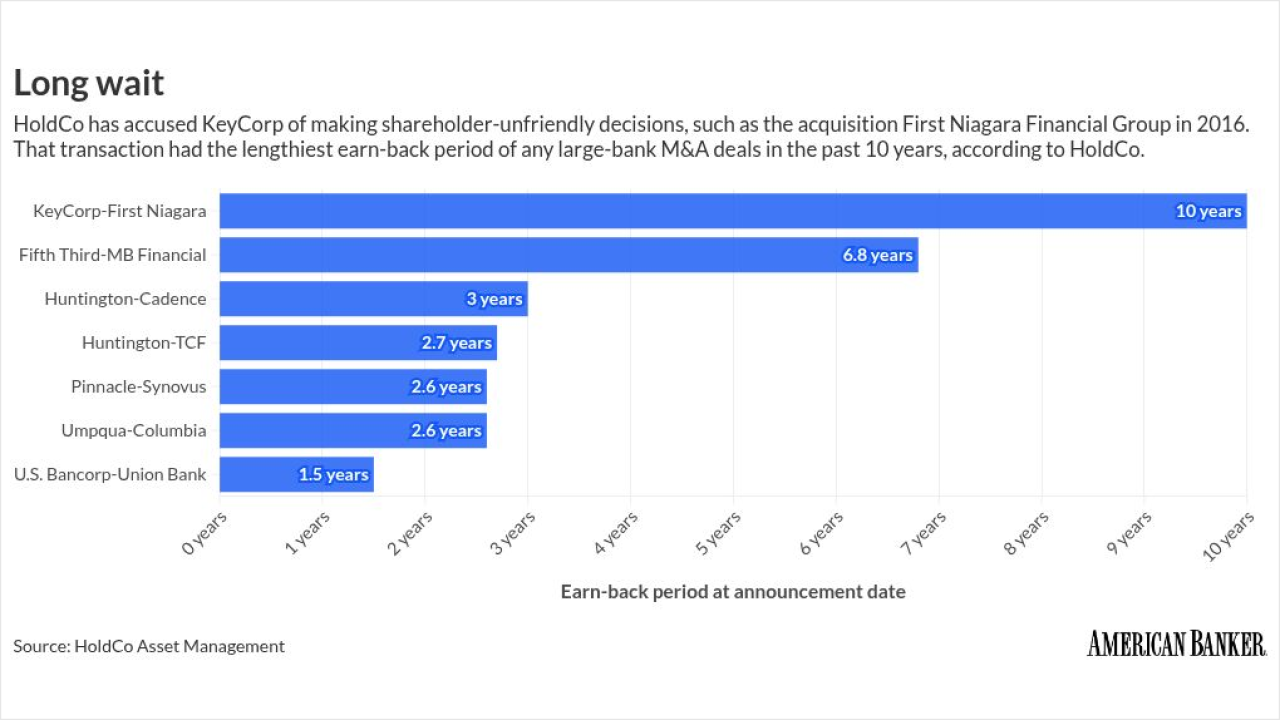
The activist investor HoldCo Asset Management said Monday that it doesn't plan to pursue proxy battles this spring at either Key or Eastern. It had been agitating publicly over the banks' M&A strategies.
February 9


