-
The announcement follows a leave of absence in which Ginnie Mae President Joe Gormley helped cover the Federal Housing Admission Commissioner's responsibilities.
 June 5
-
A credit union service organization is buying the division, which includes mortgage services provider QRL, while the seller repositions its home loan business.
June 5
-
The Bureau of Labor Statistics Friday reported that the economy added 172,000 jobs in May and revised March and April's employment upward, making the Federal Reserve less likely to cut interest rates to support the labor market in the near term.
 June 5
-
Mortgage industry participants say Federal Housing Finance Agency Director Bill Pulte's new role as acting director of national intelligence could imperil progress on a potential initial public offering of Fannie Mae and Freddie Mac.
June 5
-
The 30-year fixed rate mortgage average not only remains where it was in September, it is still nearly a half-percentage point above February's trough.
 June 4
-
A revised Basel III endgame proposal from the Federal Reserve would fundamentally change the economics of mortgage lending for banks — improving returns, reshaping pricing and reopening a market they sidelined.
June 4
-
Analysts said Bill Pulte's new additional role as spy chief will further delay GSE privatization efforts, although that could change if he formally departed.
 June 2
-
The Department of Veterans Affairs will accept the legislatively-mandated partial-claim option soon and servicing systems must accommodate it by November 28th.
June 2
-
While disparate impact has never been under greater legal pressure, its influence on the future of housing policy and even employment continues to grow, showing that reducing discriminatory effects is good for business.
June 2
-
Bank of Nova Scotia agreed to acquire Maple Financial Holdings Inc., which owns a small US commercial bank, as the Canadian firm looks to expand its structured-finance business in the American mortgage industry.
June 1 -
The total delinquency rate rose 0.2 percentage points annually in March, with the share of loans 90 days late rising out of the range they were in since 2024.
May 29
-
The test of automated risk assessments for government-sponsored enterprise-eligible mortgages are designed to help determine when waivers might be possible.
May 29
-
The streamlining is designed to further expedite a process which allows mortgage companies to get a case number for loans on single units even if the building they're in doesn't have one.
May 26
-
The latest acquisition activity points to the importance of decisions lenders make regarding their MSRs in 2026 and some considerations unique to each company.
May 26
-
Homebuyers applying for Federal Housing Administration loans in community property states are facing hurdles that current market conditions have heightened.
May 26
-
With the 10-year Treasury yield at levels not seen in 52 weeks, the 30-year fixed rate mortgage rose 15 basis points over last Thursday, Freddie Mac said.
May 21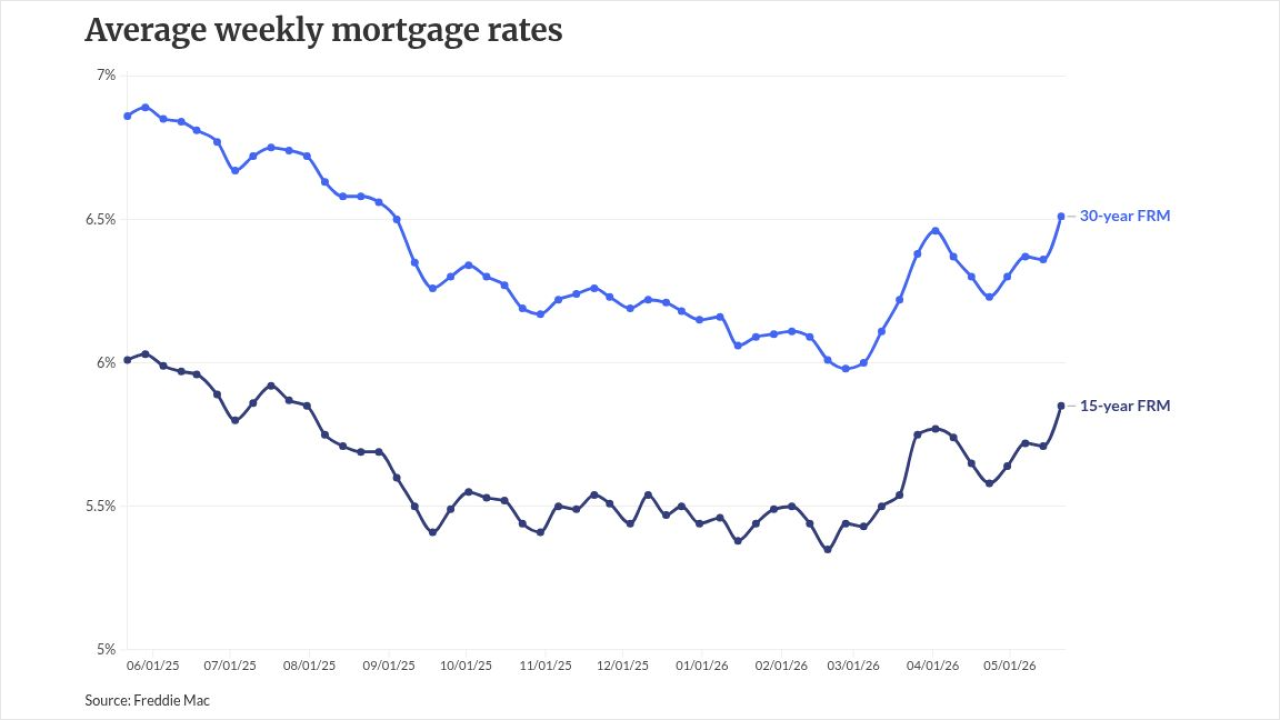
-
A capital rule overhaul could make bank charters attractive to independent mortgage banks, reshaping who controls home lending in America.
May 21
-
The Mortgage Bankers Association now predicts a Federal Reserve rate hike to arrive in 2027, as housing price growth also slows over the next two years.
 May 18
-
Foreclosure filings were reported on 42,430 properties in the United States last month, down 8% from the month prior but up 18% from a year ago.
 May 14
-


